A 99% Pure Peptide Can Still Be Underfilled
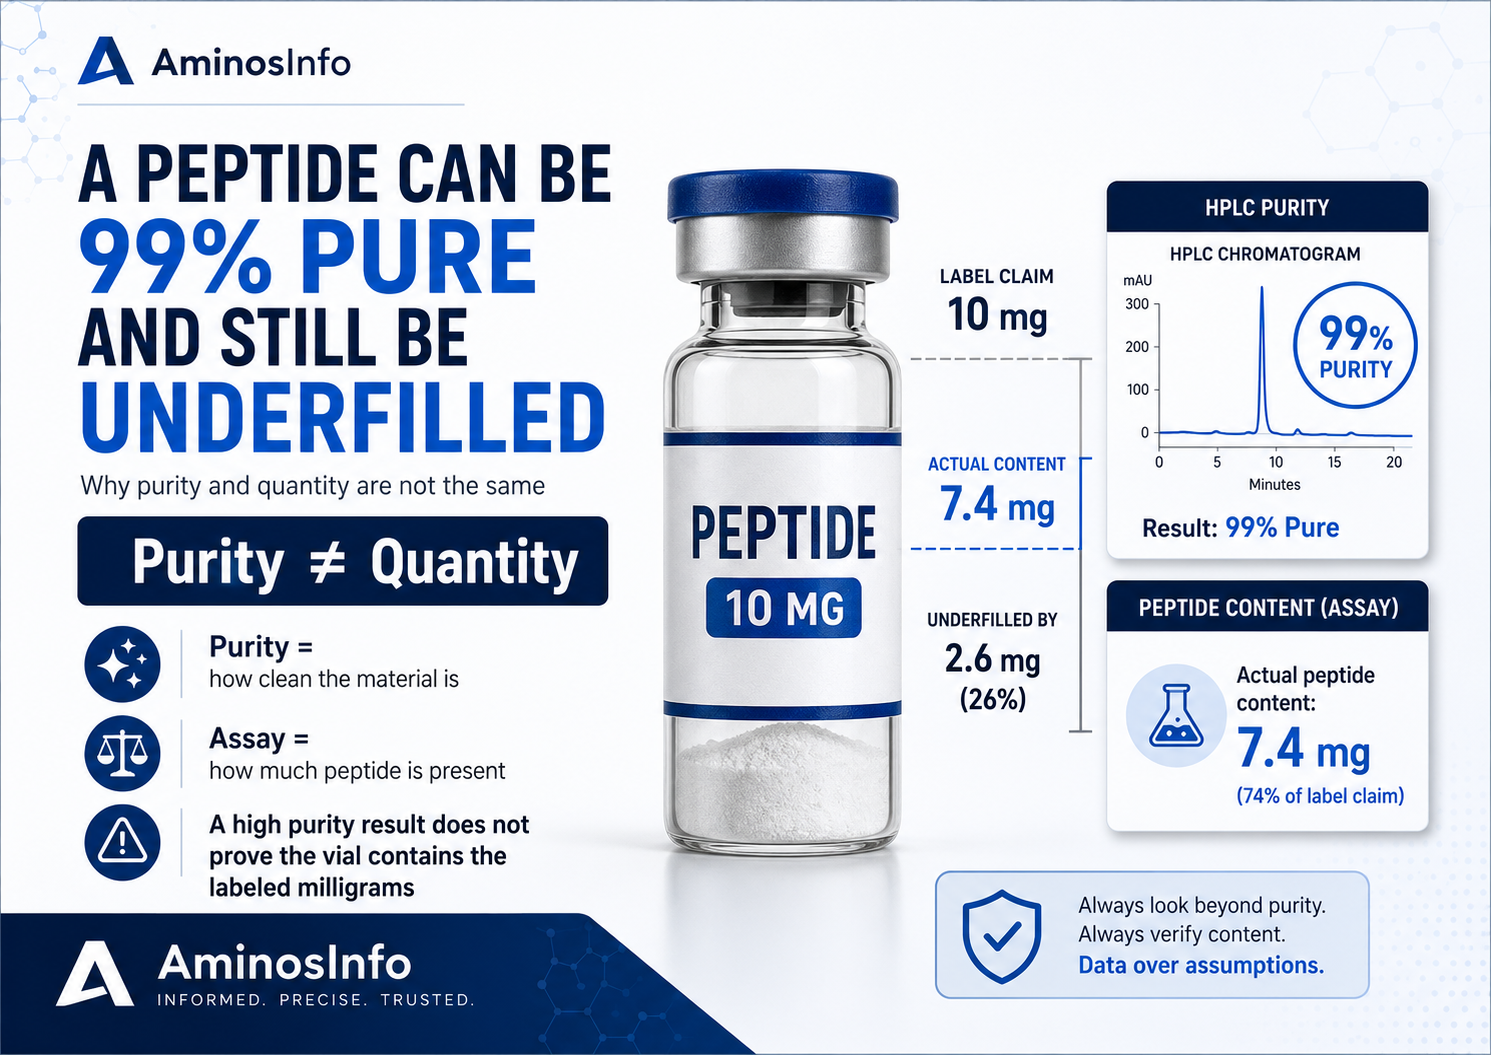
In addition, A 99% pure peptide can still be underfilled because purity describes the comparative cleanliness of detected material, not the number of milligrams in the vial. Quantity requires a separate assay.
Therefore, Important context: This article is for scientific and lab education. A high purity result does not establish that a material is sterile, safe, approved, effective, or suitable for human use. Only trained professionals should handle research-use-only materials in properly controlled research settings under relevant laws and institutional requirements.
Likewise, A 99% pure peptide can still be underfilled because purity and quantity answer different questions. First, HPLC purity measures the comparative area of detected peaks. Next, an assay measures how much target peptide is present. Finally, sampling determines how confidently the result represents the batch.
However, many COAs place the purity percentage in the most visible position. Therefore, readers may mistake a cleanliness result for proof of the labeled milligrams.
Why a 99% Pure Peptide Can Still Be Underfilled
Moreover, Many peptide certificates of analysis prominently display a result such as “Purity: 99.1%”. Because the number is close to 100%, readers may assume it means the vial contains nearly 100% of the peptide amount printed on the label. That is usually not what the number means.
By contrast, In many cases, the reported purity is an HPLC or UPLC HPLC area percentage. It describes the comparative area of the main detected peak compared with the total included detected peak area under that method. It is primarily a statement about the composition of the detected HPLC material—not a direct measurement of the total milligrams in the vial.
Purity asks:
For example, of the components detected and counted by this method, what proportion of the HPLC signal the analyst assigned to the main peptide peak?
Quantity asks:
Therefore, how many milligrams of the intended peptide are actually present in this vial or sample?
Moreover, a vial can contain a small amount of very clean peptide. As a result, it can also contain the expected total amount of peptide with a less favorable impurity profile. Likewise, a complete evaluation requires both purity information and a suitable measured assay.
What Does “99% Pure” Usually Mean?
By contrast, For many synthetic peptide reports, purity the lab measures using reversed-phase high-performance liquid chromatography, commonly abbreviated RP-HPLC. The laboratory dissolves a portion of the material, injects it into the HPLC system, separates detectable components, and records peaks as they leave the column.
However, analysts generally assign the main peak to the target peptide using retention behavior, a test standard, mass spectrometry, or another identity-supporting procedure. For example, the instrument software calculates the area under the main peak and compares it with the total area of other included peaks.
Therefore, If the main peak represents 99% of the counted area, the report may state 99% purity by HPLC area area comparison. This can be valuable information. It can indicate that relatively little chromatographically detected related material appeared outside the main peak under the stated method.
However, the method limits the result through what it can separate, what the detector can see, how the peak counting the lab performed, the wavelength used, the reporting threshold, and whether all relevant components produced similar detector responses.
What the 99% number may support
- By contrast, the main detected component dominated the chromatogram.
- In addition, the method found relatively few related peptide impurities under that method.
- However, the sample may have undergone effective synthesis and purification.
- For example, the HPLC result met a stated purity specification, when one the method defined.
What the 99% number does not automatically prove
- Therefore, the vial contains the labeled milligrams.
- Moreover, the main peak is definitely the correct peptide without identity support.
- The material is sterile.
- Bacterial endotoxins are absent.
- As a result, residual solvents, metals, counterions, or water are within limits.
- Likewise, the same result applies to every vial in the batch.
- By contrast, regulators have approved the material or professionals consider it suitable for human use.
How Can a Highly Pure Peptide Be Underfilled?
In addition, The easiest way to understand the issue is to separate cleanliness from amount.
However, imagine two sealed containers of laboratory-grade sugar. For example, one contains 100 grams, and the other contains only 70 grams. Therefore, if both samples are 99.5% chemically pure, the smaller container is still underfilled comparative to a 100-gram label. Moreover, its purity did not change simply because the container received less material.
As a result, the same principle applies to peptides. Likewise, a vial labeled “10 mg” could contain 7 mg of peptide that is 99% chromatographically pure. By contrast, the peptide material may be relatively clean, but the quantity claim would still be inaccurate.
Simple illustration: three vials can all be 99% pure
In addition, in all three examples, the comparative purity can be identical. However, the only difference is how much peptide is present. For example, the lab must measure that amount with a quantitative method rather than inferred from HPLC purity.
Common reasons an underfill can occur
Incorrect bulk concentration
Therefore, the solution prepared before vial filling may contain less peptide per milliliter than intended because of formulation, dilution, calculation, or measurement errors.
Filling-volume variation
Moreover, a filling system may dispense less solution than specified, or variation may occur between the beginning, middle, and end of a production run.
Incorrect potency correction
As a result, the raw material may not be 100% peptide by weight. Likewise, failing to correct for water, counterions, residual solvents, or assigned standard potency can reduce actual peptide content.
Transfer and processing losses
By contrast, material can be lost through adsorption to equipment, filters, tubing, containers, or during transfers and formulation.
Degradation
In addition, the intended peptide may degrade before or after filling. However, depending on the assay, related degradation products may reduce measured target-peptide content.
Unrepresentative testing
For example, a tested bulk sample or selected vial may meet expectations while other finished vials do not, especially when process controls or sampling are weak.
Why HPLC Area Percent Is Not a Milligram Measurement
Therefore, an HPLC ultraviolet detector records signal intensity as compounds pass through it. Moreover, the resulting chromatogram shows comparative detector response over time. As a result, when purity the software calculates by area area comparison, the software divides the main-peak area by the combined area of included peaks.
Likewise, the calculation does not by itself know whether the vial contained 5 mg, 10 mg, or 20 mg before the sample the analyst diluted. By contrast, laboratories commonly prepare test solutions at a chosen concentration so the signal fits the lab range of the instrument. In addition, a small vial and a large vial analysts can dilute both to produce similar test-solution concentrations and nearly identical chromatograms.
However, Key point: A HPLC purity run can produce a 99% result even when the analyst used only a tiny portion of the vial. Unless the lab calibrates the method and tracks the original sample amount quantitatively, the chromatogram does not establish total vial content.
Area percent is comparative
Suppose a chromatogram contains:
| Peak | counted area | Area percentage | Possible interpretation |
|---|---|---|---|
| Main peptide peak | 990,000 | 99.0% | Dominant detected component |
| Impurity A | 6,000 | 0.6% | Minor detected component |
| Impurity B | 4,000 | 0.4% | Minor detected component |
| Total | 1,000,000 | 100% | Included counted signal |
Therefore, this tells us the comparative distribution of included detector signal. Moreover, it does not tell us the absolute mass of peptide in the original vial unless the method also includes a valid measured calibration and sample-preparation calculation.
Not every component responds equally
As a result, area area comparison often assumes that the main peptide and detected impurities produce sufficiently similar detector responses at the selected wavelength. Likewise, that assumption may be imperfect. By contrast, different sequences or modifications can absorb ultraviolet light differently. In addition, components that do not absorb strongly at the chosen wavelength the detector may underestimate or miss.
However, water, many salts, some added ingredients, and certain non-UV-active contaminants may not appear as meaningful peaks. Therefore, 99% HPLC area purity readers should not interpret as meaning that 99% of the total dry cake’s physical mass is the target peptide.
Dilution can hide the original quantity from view
Consider two vials:
- Therefore, vial A contains 5 mg of peptide.
- Moreover, vial B contains 10 mg of peptide.
As a result, if the laboratory prepares both at a final lab concentration of 1 mg/mL and injects the same volume, their HPLC purity chromatograms could look nearly identical. Likewise, the chromatogram compares composition at the prepared concentration. By contrast, it does not retain an automatic memory of how much total peptide was originally in each vial.
What Test Actually Measures Peptide Quantity?
In addition, A measured assay or content determination the lab needs to evaluate how much peptide is present. The method must be appropriate for the intended measurement and should use suitable reference materials, checked instrument response, controlled sample preparation, defined calculations, and appropriate validation or scientific qualification.
For example, FDA describes assay as a test of how much drug is present and whether it matches the labeled amount. In addition, impurity testing answers a separate question about related material. See the FDA Q6A specifications guidance.
Common measured approaches
| Approach | How it can support quantity | Important limitations |
|---|---|---|
| checked HPLC/UPLC assay | As a result, compares sample response with a qualified reference standard of assigned content or potency. | Likewise, requires correct standard potency, sample preparation, ability to distinguish the target, straight-line response, correctness, and calculation basis. |
| Amino acid analysis | By contrast, hydrolyzes the peptide and quantifies selected amino acids to estimate peptide content. | In addition, hydrolysis recovery, unstable residues, sequence composition, and free amino acids can affect interpretation. |
| measured NMR | However, uses signal comparison with a known reference to estimate absolute material content. | For example, requires suitable solubility, resolved signals, appropriate reference, and expert interpretation. |
| mass-balance calculation | Therefore, calculates peptide content after accounting for water, solvents, inorganic residues, counterions, and HPLC impurities. | Moreover, depends on complete and accurate measurement of all important non-peptide components. |
| weight-based fill measurement | As a result, measures how much total material or solution the filling system dispensed. | Likewise, does not always distinguish peptide from water, salts, added ingredients, or impurities. |
A measured HPLC assay is not the same as an HPLC purity run
By contrast, the same broad instrument category can serve different purposes. In addition, one HPLC method may calculate comparative impurity area percentages. However, another may quantify peptide concentration against a reference-standard calibration curve. For example, a COA that merely says “HPLC” is incomplete unless it identifies whether the method served for identity, purity, assay, or another purpose.
HPLC purity method
Therefore, often uses area area comparison to compare the main peak with detected impurity peaks. Moreover, the output the report may list area percent.
HPLC assay method
As a result, uses checked response and controlled preparation to calculate concentration, mass, or percent of label claim.
Reference-standard quality is critical
Likewise, A measured test standard needs an assigned value that suits assay use. Moreover, USP notes that analysts should not assume a reference standard equals 100% peptide by mass unless the assigned value supports that claim. See the USP reference-standard FAQs.
However, if a laboratory weighs 1.00 mg of a test standard that is only 85% peptide on an as-is basis but treats it as 100%, the resulting assay the calculation can produce bias. For example, correct potency assignment and calculation are therefore essential.
Total Cake Weight Is Not always Net Peptide Content
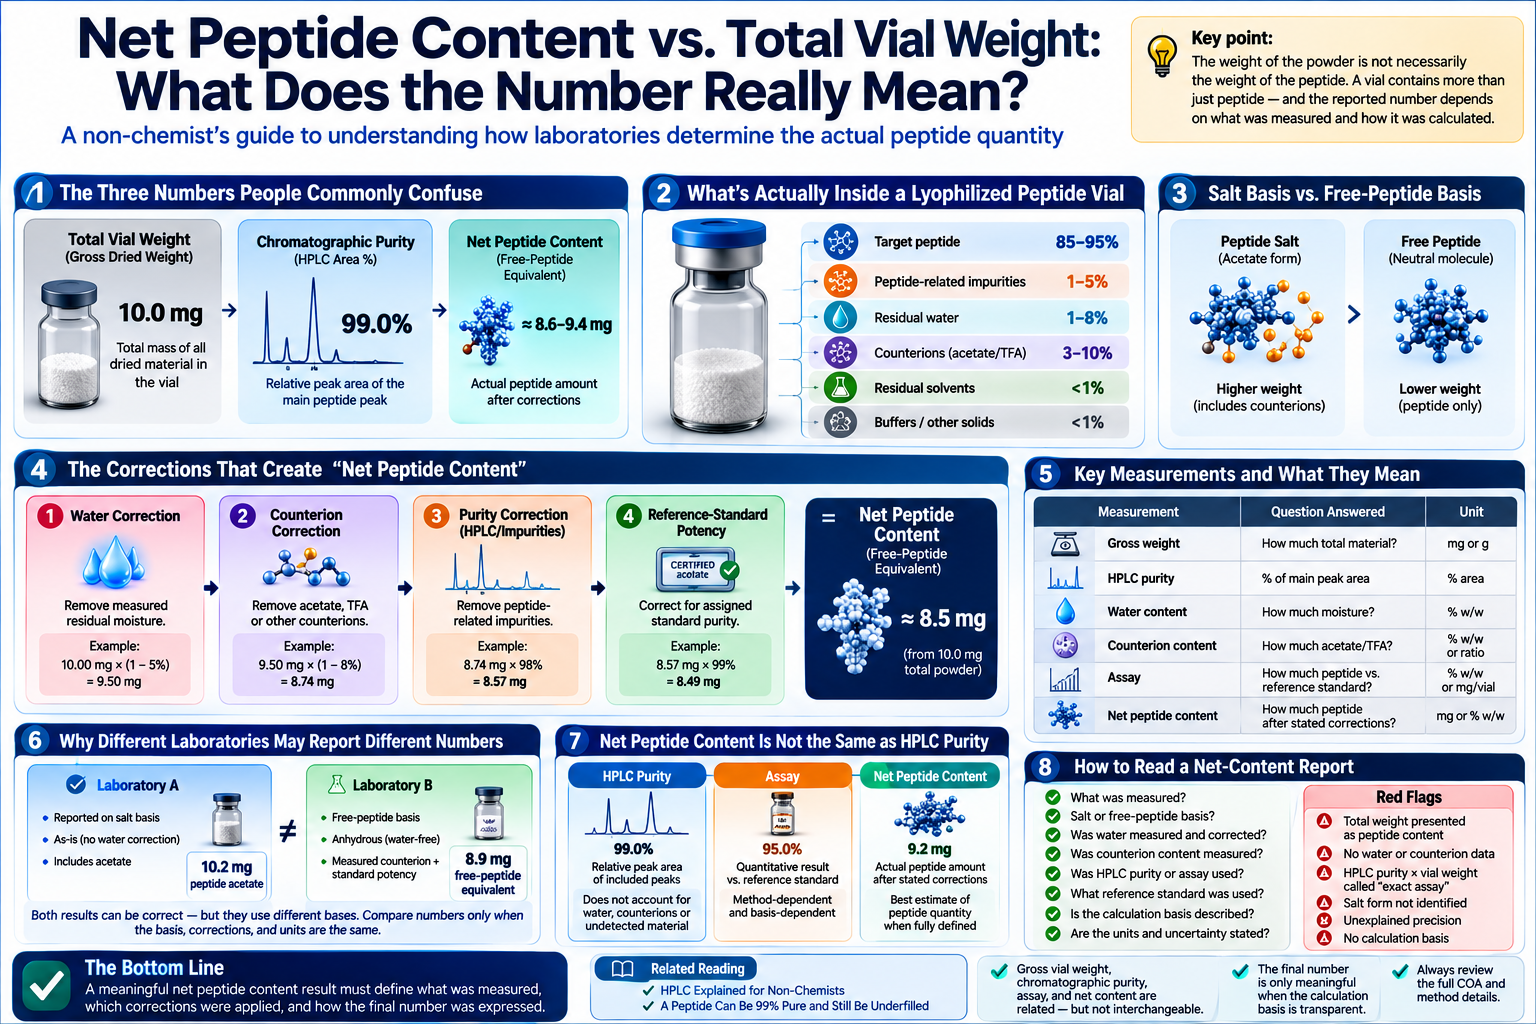
Therefore, another common misunderstanding is that weighing the dried contents of a vial proves the peptide quantity. Moreover, the visible cake may contain more than the target peptide.
As a result, Gross vial content or total dry weight can include every non-evaporating component remaining after freeze-drying. Net peptide content is the actual amount of the intended peptide, calculated or measured on a clearly defined basis.
Why weighing alone can mislead
By contrast, assume a vial’s dry cake weighs 12 mg. In addition, that does not always mean it contains 12 mg of peptide. However, the composition might include:
Illustrative 12 mg dry cake
For example, in this example, the cake weighs more than the 10 mg label claim, yet the vial is still underfilled with respect to target peptide. Therefore, the extra physical mass comes from other components.
Why cake size is even less reliable than cake weight
Moreover, these factors affect cake volume: formulation concentration, added ingredients, freezing rate, nucleation, collapse temperature, vial dimensions, vacuum conditions, and drying parameters. As a result, two vials containing the same peptide quantity can look dramatically different. Likewise, a taller or fluffier cake is not proof of more peptide.
added ingredients, Water, Salts, and Counterions
By contrast, to understand net peptide content, it helps to know what else may be present in a synthetic peptide material or lyophilized vial.
added ingredients
In addition, bulking agents, buffers, stabilizers, or other formulation ingredients can improve cake formation, solubility, or processing. However, their mass is not peptide mass.
Residual water
For example, lyophilized materials are not always completely water-free. Therefore, residual moisture contributes to physical weight and can affect stability.
Counterions
Moreover, peptides manufacturers commonly isolate peptides as salts, such as acetate or TFA forms. As a result, counterions add mass but are not part of the peptide sequence itself.
Residual solvents
Likewise, trace solvents from synthesis, purification, or processing can remain and require separate lab assessment.
Related impurities
By contrast, deletion sequences, truncations, oxidation products, and other peptide-related materials can contribute to total mass.
Reagents and inorganic residues
In addition, residual process chemicals or inorganic material may contribute to mass even if they are not visible in a standard UV chromatogram.
“As is,” “water-free,” and “salt-free” are not interchangeable
However, a peptide result reports may use different bases:
- For example, As-is basis: reflects the material in its tested condition, including relevant water and counterions.
- Therefore, water-free basis: mathematically corrects for measured water.
- Moreover, Salt-free or free-peptide basis: corrects for counterions when appropriate.
- As a result, Purity-corrected basis: adjusts for measured related impurities.
- Likewise, Percent of label claim: compares the measured amount with the labeled amount printed on the vial.
By contrast, a number without a clearly stated basis can be easily misunderstood. In addition, “10.0 mg” should prompt the question: 10.0 mg of total dried material, peptide salt, free peptide equivalent, or target peptide after corrections?
Worked Examples for a Vial Labeled 10 mg
Example 1: High purity, true underfill
| Label claim | 10 mg |
|---|---|
| HPLC purity | 99.3% area |
| measured peptide assay | 7.4 mg per vial |
| Interpretation | However, the detected peptide material is highly pure by the reported HPLC method, but the vial contains only 74% of the labeled peptide quantity. |
For example, the purity result does not cancel the underfill. Therefore, both statements can be true simultaneously.
Example 2: Correct total cake weight, peptide underfill
| Label claim | 10 mg peptide |
|---|---|
| Total dried cake weight | 11.5 mg |
| HPLC purity | 99.0% area |
| Net peptide content | 8.9 mg |
| Other measured or formulated material | Moreover, added ingredients, water, counterions, and related components |
| Interpretation | As a result, the cake weighs more than 10 mg, but the target peptide amount is still below the label claim. |
Example 3: Purity looks lower, quantity is correct
| Label claim | 10 mg |
|---|---|
| HPLC purity | 97.8% area |
| measured peptide assay | 10.1 mg per vial |
| Interpretation | Likewise, the vial contains about the labeled quantity, but the detected impurity profile is less favorable than a 99% purity result. |
By contrast, quantity compliance does not erase an impurity concern. In addition, purity and assay reviewers must evaluate each one against appropriate specifications.
Example 4: Only purity the lab tested
| Label claim | 10 mg |
|---|---|
| HPLC purity | 99.6% area |
| Mass spectrometry | However, observed mass consistent with expected peptide |
| measured assay | Not reported |
| Interpretation | For example, the report supports identity and high HPLC purity, but the labeled 10 mg quantity remains analytically unconfirmed by this report. |
Example 5: Percent assay requires context
| Reported assay | 102% |
|---|---|
| labeled label claim | 10 mg |
| Possible interpretation | Therefore, about 10.2 mg equivalent under the assay calculation |
| Questions still required | Moreover, was the standard potency corrected? As a result, is the result per vial or an average? Likewise, what is the reporting basis and acceptance range? |
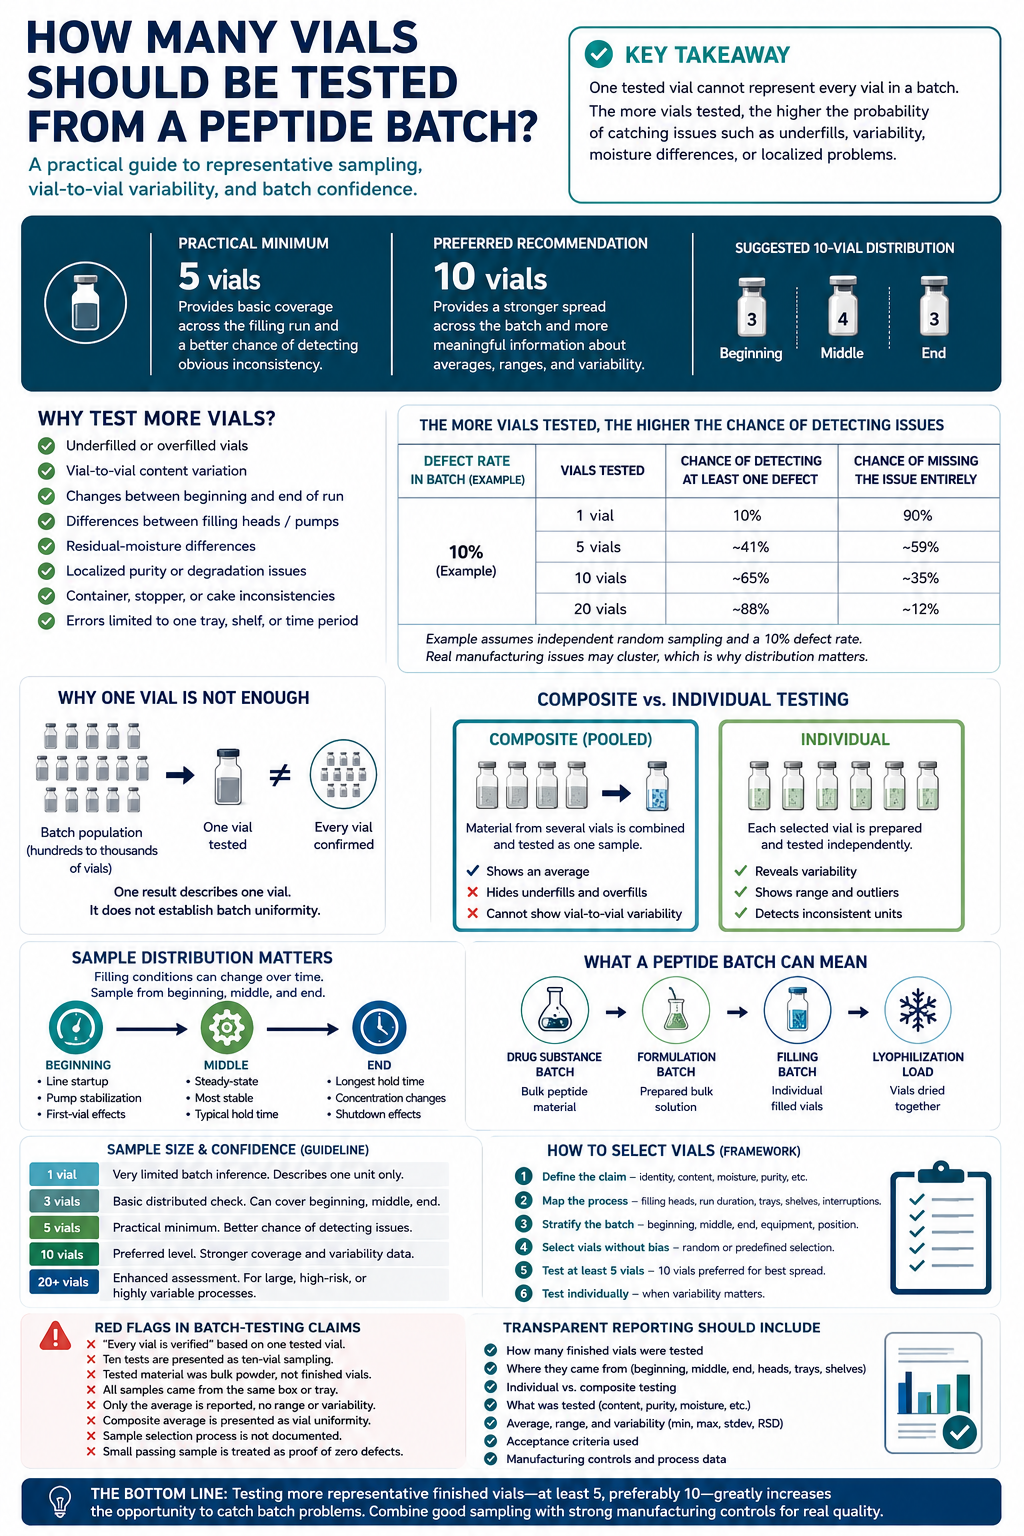
Sampling Matters: One Good Vial Does Not Prove the Entire Batch
By contrast, even a well-designed measured assay applies directly only to the sample that the lab tested. In addition, if one vial from a batch of 1,000 the lab analyzes, the result proves what the lab found in that vial. However, it does not mathematically establish that every other vial contains the same amount.
For example, confidence in batch uniformity depends on:
- Therefore, the correctness and precision of the filling process
- Bulk-solution mixing and homogeneity
- Moreover, controls for concentration before and during filling
- As a result, equipment calibration and in-process monitoring
- Likewise, the number of finished vials sampled
- By contrast, whether sampling was random and properly selected
- In addition, whether vials from different points in the run the lab tested
- However, whether results the report averaged results in a way that could conceal individual underfills
Bulk powder testing does not prove finished-vial content
For example, a manufacturer may test the purity and identity of bulk peptide powder before formulation. Therefore, that report can provide useful information about the raw material, but it does not establish that each finished vial received the correct peptide amount. Moreover, filling, formulation, transfer, and freeze-drying occur after the bulk powder stage and introduce additional opportunities for variation.
An average can hide individual failures
As a result, suppose three vials contain 8 mg, 10 mg, and 12 mg. Likewise, their average is 10 mg, but two of the three individual vials differ greatly from the labeled amount. By contrast, a report should state whether the result is a single-vial value, an average, a pooled sample, or a range across individual units.
In addition, Watch for pooled testing: Combining material from several vials can estimate an average, but it may conceal vial-to-vial variation. Individual-unit results provide different information from a pooled sample.
How COA Language Can Create False Confidence
How to Interpret the Main Result
For example, a COA does not need to contain an outright false statement to mislead. Therefore, unclear wording, selective formatting, or unsupported marketing conclusions can cause readers to infer more than the data show.
Moreover, Misleading claim: “Laboratory tested at 99.4%, confirming the vial contains 10 mg.”
Problem: A purity percentage does not confirm total vial quantity unless a measured assay was also performed.
As a result, Misleading claim: “The powder weighed 10 mg, so it contains 10 mg of peptide.”
Problem: Total powder mass may include water, counterions, added ingredients, solvents, and related impurities.
Important Limits to Keep in Mind
Likewise, Misleading claim: “HPLC confirmed both purity and potency.”
Problem: The document must show whether a checked measured assay the lab performed. The instrument name alone does not define the test purpose.
In addition, Misleading claim: “The vial looks full, so it cannot be underfilled.”
Problem: Visual cake size depends heavily on formulation and freeze-drying conditions.
However, Misleading claim: “One tested vial proves the entire batch contains the labeled amount.”
Problem: Batch uniformity depends on process controls and a properly selected sampling plan.
Terms that require clarification
| COA term | Why it can be unclear | Clarifying question |
|---|---|---|
| Purity | For example, may mean HPLC area percent rather than mass fraction. | Therefore, purity by which method and reported on what basis? |
| Content | Moreover, may refer to gross powder, peptide salt, free peptide, or label claim. | As a result, content of what, in which units, and after which corrections? |
| Assay | Likewise, writers may use loosely even when no checked measured test the report shows. | By contrast, what standard, calibration, calculation, and validation supported it? |
| Potency | In addition, can mean chemical content or biological activity depending on context. | However, does this refer to mass content or a biological response assay? |
| Fill weight | For example, may be solution weight before drying or total cake mass afterward. | Therefore, was target-peptide mass independently determined? |
| Net peptide | Moreover, suppliers may use different correction formulas. | As a result, were water, counterions, purity, and salt form accounted for? |
How to Verify a Peptide Milligram Claim
How to Interpret the Main Result
Likewise, when a vial carries a specific amount on its label, look for evidence that directly addresses that quantity. By contrast, the following review process helps separate a real content measurement from a purity result serving as a substitute.
- In addition, Match the lot number. Confirm that the report applies to the exact batch or lot printed on the vial. A test from a different batch does not verify the current product.
- Therefore, Find a separate measured result. Look for “assay,” “peptide content,” “content per vial,” “percent of label claim,” or another clearly measured result—not only “purity.”
- As a result, Identify the method’s purpose. Determine whether HPLC served for comparative purity or checked quantity. The method description should make this clear.
- In addition, Check the units. A useful content result should state units such as mg/vial, mg/mL, or percent of a defined label claim.
- For example, Check the reporting basis. Determine whether the result is as-is, water-free, salt-free, free-peptide equivalent, or corrected for standard potency and HPLC purity.
- Moreover, Review the reference standard. Confirm that the standard was suitable for measured use and had an assigned potency or content value.
- Likewise, Review sample preparation. The report should account for the entire vial, dilution volumes, transfer recovery, and calculations needed to convert instrument response into total vial content.
- In addition, Ask how many vials the lab tested. One vial, multiple individual vials, and a pooled pooled sample provide different levels of information.
- For example, Look for a specification. A result reviewers should compare with a set in advance acceptable range rather than merely declared “pass.”
- Moreover, Keep purity separate. Evaluate the impurity profile and measured content as two independent results that both matter.
What a stronger testing packet looks like
Important Limits to Keep in Mind
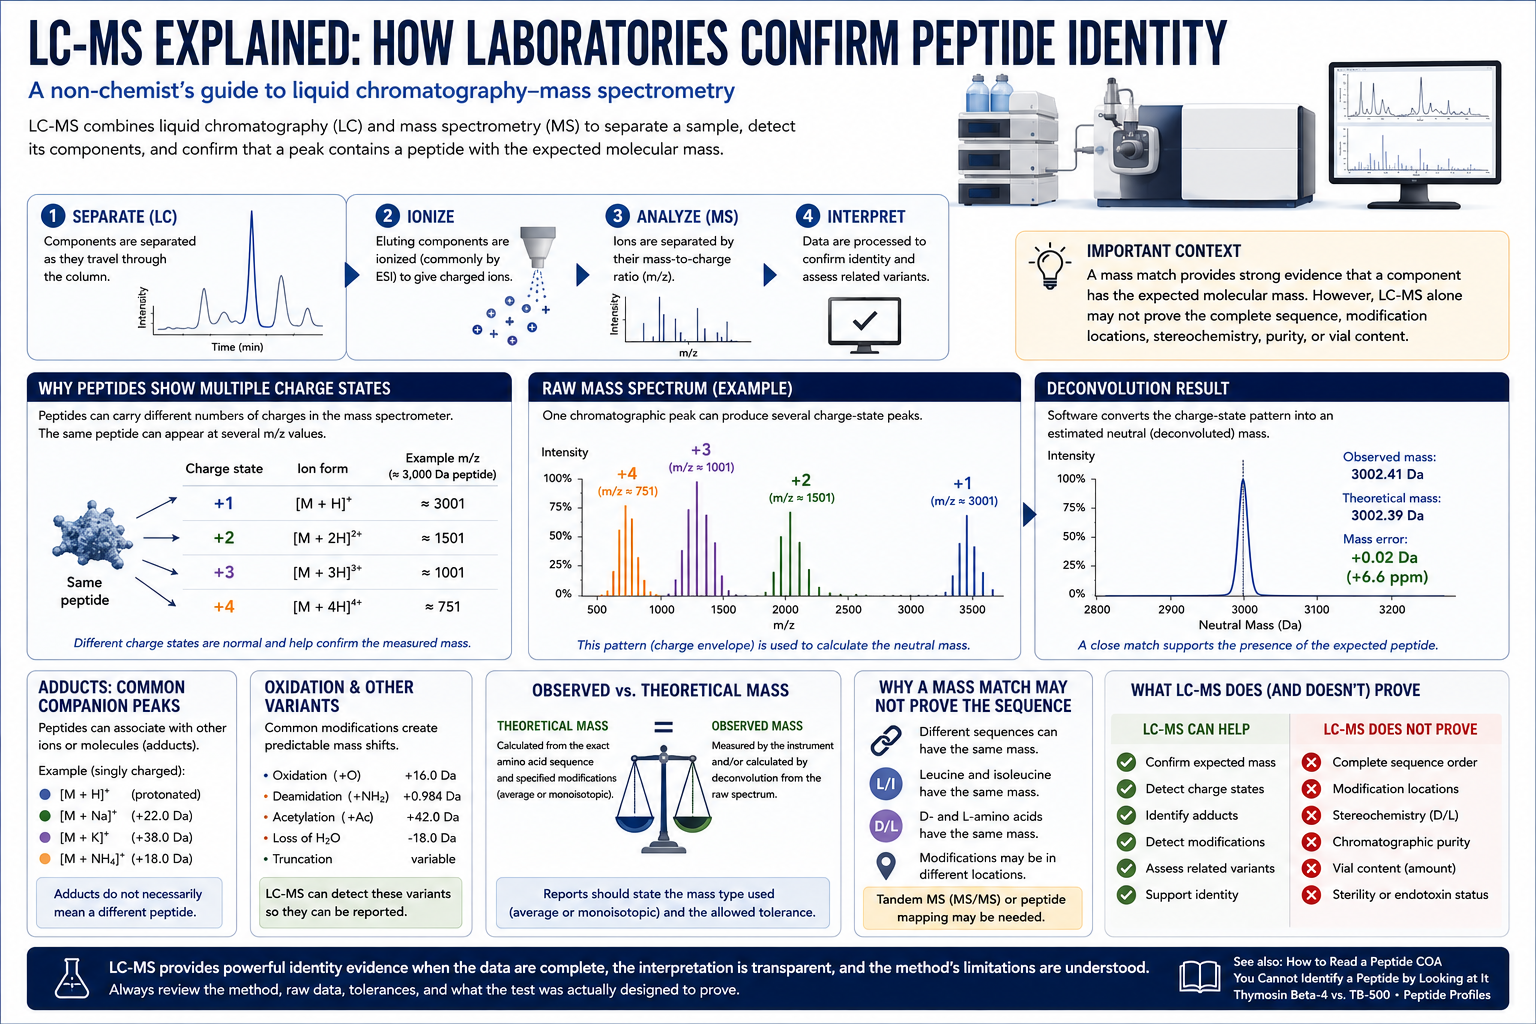
- Likewise, identity supported by mass spectrometry or another suitable method
- By contrast, hPLC purity with full chromatogram and peak counting table
- In addition, measured peptide content reported in mg per vial
- However, reference-standard identity and assigned potency documented
- For example, clear corrections for water, counterions, and other relevant components
- Therefore, multiple finished vials sampled across the filling run
- Moreover, individual results or variation statistics, not only a pooled average
- As a result, lot-specific report from a verifiable laboratory
- Likewise, separate testing for other relevant quality attributes
By contrast, The most useful question to ask a supplier: “Do you have a lot-specific measured peptide-content result in milligrams per finished vial, separate from the HPLC purity percentage?”
Purity, Identity, Quantity, and Safety Answer Different Questions
| Quality attribute | Question answered | Example result | Can it prove 10 mg is present? |
|---|---|---|---|
| Identity | In addition, is the material consistent with the expected peptide? | Observed mass conforms | No |
| Purity | However, how much of the detected HPLC signal belongs to the main peak? | 99.2% area | No |
| Assay | For example, how much intended peptide is present? | 9.8 mg/vial | Yes, when suitable |
| Sterility | Therefore, were viable microorganisms detected under the test conditions? | No growth | No |
| Endotoxin | Moreover, was bacterial endotoxin below a defined limit? | <0.5 EU/mg | No |
| Water | As a result, how much residual water is present? | 2.1% | No |
Frequently Asked Questions About Peptide Purity and Underfilling
Purity, Quantity, and Cake Size
Does 99% purity mean 9.9 mg in a 10 mg vial?
Likewise, no. By contrast, multiplying 10 mg by 99% assumes that the vial already contains exactly 10 mg of total peptide-related material and that the purity percentage represents a true mass fraction. In addition, a typical HPLC area-purity result does not establish either assumption. However, a separate measured assay the lab needs.
Can I calculate peptide quantity from the HPLC chromatogram?
For example, only when the method the lab specifically designed and checked for measured assay, with suitable standards, controlled sample preparation, proven or with evidence justified performance, and the necessary dilution calculations. Therefore, a standard area-normalized purity chromatogram is not enough.
Does a larger lyophilized cake mean more peptide?
Moreover, no. As a result, cake size depends on added ingredients, concentration, freezing conditions, vial dimensions, residual moisture, and the freeze-drying cycle. Likewise, visual volume is not a reliable measure of peptide mass.
Does weighing the powder prove the milligrams?
By contrast, it proves only the gross weight of recovered material, subject to weighing correctness and handling loss. In addition, the material may include peptide, counterions, water, added ingredients, solvents, and impurities. However, additional analysis the lab needs to determine net target-peptide content.
Assay, Overfill, and Reference Standards
What is “percent of label claim”?
For example, it compares the measured quantity with the labeled labeled quantity. Therefore, for a 10 mg vial, a properly determined result of 95% of label claim would correspond to about 9.5 mg under the stated calculation basis.
Can a vial be overfilled and still 99% pure?
Moreover, yes. As a result, a vial containing 12 mg of peptide can produce the same 99% HPLC purity result as a vial containing 7 mg. Likewise, purity does not determine whether the quantity is low, correct, or high.
Is amino acid analysis better than HPLC?
By contrast, they answer different questions and have different strengths and limitations. In addition, amino acid analysis can help quantify peptide, while HPLC labs widely use for purity and labs can also design HPLC for assay. However, orthogonal methods often provide stronger evidence than relying on a single technique.
Why can a reference standard not be assumed to be 100%?
For example, a reference standard may contain moisture, counterions, residual solvents, inorganic residues, and HPLC impurities. Therefore, measured use requires an assigned value or with evidence supported potency correction.
Sampling and What Buyers Should Review
Does testing one vial prove every vial is correctly filled?
Moreover, no. As a result, it directly describes the tested vial. Likewise, confidence in the entire batch depends on process controls, properly selected sampling, the number and location of sampled units, and observed vial-to-vial variation.
What should a buyer look for besides purity?
By contrast, look for lot matching, identity testing, measured peptide content, clear units and reporting basis, reference-standard information, properly selected finished-vial sampling, full chromatograms, and separate testing for any other quality claims being made.
Final Takeaway
In addition, a peptide can be 99% chromatographically pure and still be greatly underfilled because purity describes the comparative composition of detected material, while assay measures how much target peptide is present. However, one result cannot replace the other.
For example, the most credible peptide testing does not rely on a single impressive percentage. Therefore, it combines identity testing, a suitable purity method, a properly checked measured assay, clear reporting units, appropriate reference standards, transparent calculation bases, and properly selected finished-vial sampling.
Moreover, Remember: “99% pure” may tell you that the detected peptide material is relatively clean. Only a suitable measured content test can tell you whether the vial actually contains the labeled milligrams.
Technical References and Further Reading
- Likewise, U.S. Food and Drug Administration. Drug Quality Sampling and Testing Programs. Updated March 25, 2026. https://www.fda.gov/drugs/science-and-research-drugs/drug-quality-sampling-and-testing-programs
- Therefore, International Council for Harmonisation. ICH Q2(R2): Validation of lab Procedures. 2023. https://database.ich.org/sites/default/files/ICH_Q2%28R2%29_Guideline_2023_1130.pdf
- By contrast, International Council for Harmonisation. ICH Q14: lab Procedure Development. https://www.ich.org/page/quality-guidelines
- For example, U.S. Food and Drug Administration. Q6A Specifications: Test Procedures and Acceptance Criteria for New Drug Substances and New Drug Products. https://www.fda.gov/regulatory-information/search-fda-guidance-documents/q6a-specifications-test-procedures-and-acceptance-criteria-new-drug-substances-and-new-drug-products
- Likewise, United States Pharmacopeia. Reference Standards to Support Quality of Synthetic Peptide Therapeutics. 2023. https://www.usp.org/sites/default/files/usp/document/our-work/biologics/reference_standards_to_support_quality_of_synthetic_peptide_therapeutics.pdf
- For example, United States Pharmacopeia. FAQs: Reference Standards. https://www.usp.org/frequently-asked-questions/reference-standards
- As a result, United States Pharmacopeia. Amino Acid Analysis. https://www.usp.org/sites/default/files/usp/document/harmonization/biotechnology/2026-03-24_B-01_rev_1_corr_2_-_sign-off.pdf
- In addition, U.S. Food and Drug Administration. lab Procedures and Methods Validation for Drugs and Biologics. https://www.fda.gov/files/drugs/published/lab-Procedures-and-Methods-Validation-for-Drugs-and-Biologics.pdf
- Moreover, United States Pharmacopeia. Peptide Standards. https://www.usp.org/biologics/peptides
- By contrast, U.S. Food and Drug Administration. Complex Mixtures and Peptides: Regulatory Science Research. https://www.fda.gov/industry/generic-drug-user-fee-amendments/fys-2013-2017-regulatory-science-report-complex-mixtures-and-peptides