HPLC Purity Explained for Non-Chemists
In addition, HPLC purity explained in plain language: how to read a chromatogram, understand peak-area purity, recognize excluded peaks, and avoid being misled by an impressive-looking “99% pure” result.
However, HPLC purity explained starts with one simple idea: the instrument separates compounds and records detector signals over time. First, the sample enters the column. Next, different compounds leave at different times. Finally, software measures the peaks that the method detects.
However, a 99% peak-area result does not mean that 99% of the powder is peptide by weight. Therefore, a strong COA should show the full chromatogram, peak table, peak counting range, exclusions, method details, and separate identity or assay results.
HPLC Purity Explained: What Is HPLC?
Moreover, HPLC stands for high-performance liquid HPLC testing. It is a laboratory technique used to separate compounds within a liquid sample so that they can be detected and measured.
Likewise, In simplified terms, a small amount of dissolved sample the analyst injects into a flowing liquid called the flowing solvent. That liquid carries the sample through a tightly packed column containing the column material.
In addition, different compounds interact with the column differently. However, some move through quickly. For example, others remain in the column longer. Therefore, this separation causes different parts to reach the detector at different times.
Moreover, The detector records its response as the separated parts leave the column. The resulting graph is called a chromatogram.
Likewise, hPLC can be used for several different purposes, including separation, impurity review, identity checking support, and measured analysis. By contrast, what it proves depends on the method, detector, standards, calculations, and validation—not merely on the fact that an HPLC instrument was used.
What Does a Chromatogram Show?
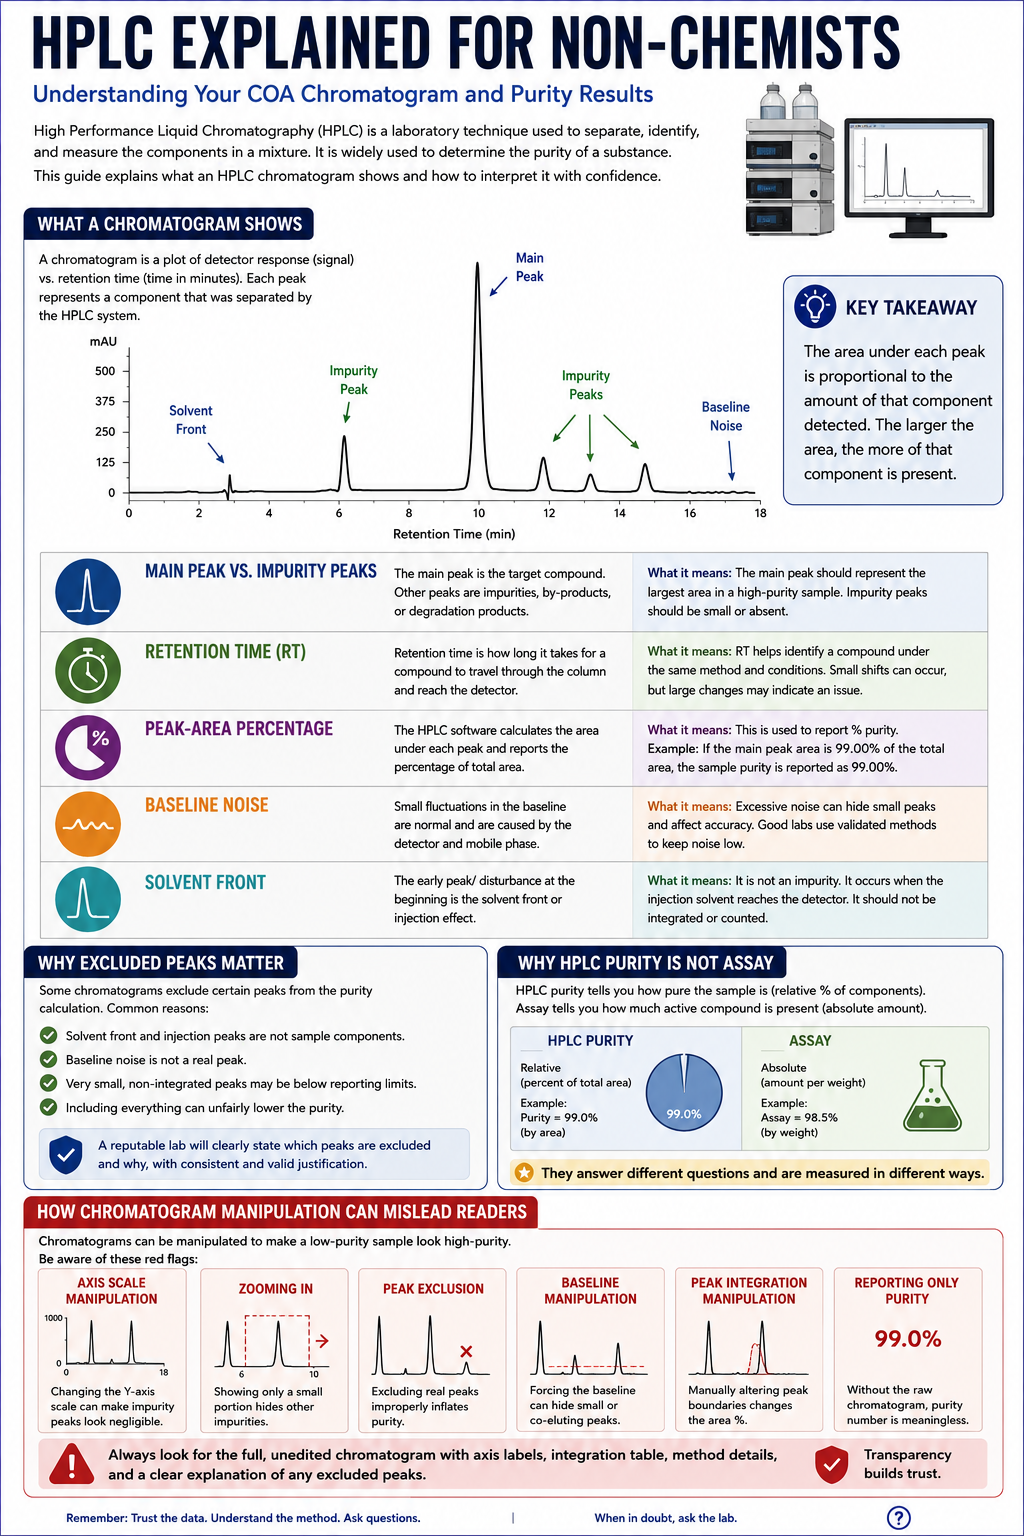
In addition, a chromatogram is a graph of the detector’s response over time.
Time
However, usually displayed in minutes. For example, it shows when each detected part leaves the HPLC testing column.
detector signal
Therefore, shows the strength of the signal recorded by the detector. Moreover, depending on the system, this may be expressed in absorbance units, millivolts, counts, or another signal measurement.
As a result, Each visible rise and fall in detector signal may appear as a peak. Ideally, one compound produces one well-separated peak. In practice, chromatograms may also contain:
- The intended target compound
- Synthesis-related impurities
- Degradation products
- Residual starting materials
- Sample-preparation artifacts
- Solvent-related signals
- In addition, system contamination or leftover sample
- Baseline noise
- Unidentified compounds
However, a chromatogram is therefore not a direct photograph of everything inside a vial. For example, it is a record of what the selected lab method and detector were capable of separating and detecting under the chosen conditions.
A chromatogram only shows what the method can see
Therefore, compounds that do not absorb strongly at the selected UV wavelength may generate a weak signal or no useful signal. Moreover, some nonvolatile salts, water, counterions, metals, microbes, and endotoxins may not be represented meaningfully in an ordinary reverse-phase HPLC purity chromatogram.
Main Peaks Versus Impurity Peaks
As a result, on a typical peptide purity chromatogram, the largest counted peak is often identified as the target peptide. Likewise, smaller peaks may be classified as impurities, related substances, degradation products, or unidentified parts.
The main peak
By contrast, The main peak is usually the peak assigned to the compound being tested. This assignment may be based on comparison with a test standard, expected retention pattern, mass spectrometry, spectral information, or a combination of lab evidence.
However, the largest peak is not automatically the correct compound. For example, an unknown contaminant could theoretically produce the largest detector signal. Therefore, proper identity confirmation requires more than simply choosing the tallest peak.
Impurity peaks
Moreover, smaller counted peaks are commonly treated as impurities. As a result, for peptide-related samples, these may include:
- Truncated peptide sequences
- Deletion sequences
- Incomplete synthesis products
- Oxidized or deamidated variants
- Likewise, aggregation-related variants detectable by the method
- Residual protecting-group derivatives
- By contrast, degradation products created during storage or handling
- Other UV-absorbing compounds
However, one visible peak does not always equal one chemically pure substance. Two compounds may elute at nearly the same time and appear as one combined peak. This is called overlapping peaks.
Therefore, When overlapping peaks occurs, the main peak may contain more than one compound. In addition, FDA validation guidance notes that peak-purity tools can help check whether one peak contains several parts. See the FDA lab steps and validation guidance.
Largest peak does not equal confirmed identity
Likewise, a chromatogram may support identity checking, but retention pattern or peak size alone is generally not final proof. By contrast, fDA guidance states that identity checking based only on a single HPLC retention time is not sufficiently specific.
What Is Retention Time?
In addition, Retention time is the amount of time between sample injection and the point at which a particular compound the detector finds as it leaves the column.
For example, a COA might report that the main peak appeared at 8.42 minutes. For example, that means the detector recorded the maximum response for that peak about 8.42 minutes after injection.
Why retention time is useful
Therefore, when a properly prepared sample and an verified test standard are analyzed under the same conditions, similar retention times can support the conclusion that the same compound may be present.
Laboratories may compare:
- The sample’s retention time
- Moreover, a test standard’s retention time
- A system-suitability standard
- As a result, a previously established relative retention time
Why retention time is not a unique fingerprint
Likewise, retention time depends on many method conditions, including:
- Column chemistry
- Column dimensions
- Particle size
- Mobile-phase makeup
- Gradient program
- Flow rate
- Column temperature
- Sample solvent
- Instrument dwell volume
- Column age and condition
By contrast, Two different compounds may also have similar retention times. Therefore, retention time can support identity under a defined method, but it does not prove identity by itself. See the USP HPLC testing guidance.
What Is Peak-Area Percentage?
For example, HPLC testing software can calculate the area under each counted peak. This value is called the peak area.
Moreover, peak area is generally more useful than peak height because it represents the detector signal across the entire width of the peak rather than only at its highest point.
Basic area-percent calculation
As a result, imagine a chromatogram with the following counted areas:
| Peak | counted area | Area percentage |
|---|---|---|
| Main peak | 990,000 | 99.00% |
| Impurity A | 6,000 | 0.60% |
| Impurity B | 4,000 | 0.40% |
| Total | 1,000,000 | 100.00% |
Likewise, under this calculation, the main peak would be reported as 99.00% by area.
What that percentage actually means
By contrast, a 99% peak-area result generally means:
Of the detector signal assigned to the peaks included in the calculation, about 99% of the counted area was attributed to the main peak.
In addition, It does not automatically mean:
- However, 99% of the powder’s physical weight is the target peptide
- For example, the vial contains 99% active ingredient by mass
- Therefore, the vial contains 99% of the amount stated on the label
- All impurities were detected
- Moreover, the largest peak was conclusively identified
- The sample is sterile
- As a result, the sample is free of endotoxin
- Likewise, the sample is free of residual solvents, metals, salts, or water
detector signal is not always equal across compounds
By contrast, area-percent calculations often assume that the target compound and the impurities produce comparable detector responses. In addition, that assumption may not always be valid.
However, at a particular UV wavelength, one impurity may absorb much more strongly than another. For example, equal physical amounts of two compounds can therefore produce different peak areas. Therefore, accurate impurity measurement may require individual response factors, calibrated standards, or proven assumptions.
Moreover, FDA guidance separates area-percentage impurity calculations from measured weight or concentration results. Moreover, the report should state the calculation method and detector basis. See the FDA lab validation guidance.
Baseline Noise, Drift, and Solvent Fronts
By contrast, The line running across the chromatogram between peaks is called the baseline. In an ideal system, it would be perfectly flat. Real chromatograms rarely have a completely motionless baseline.
Baseline noise
For example, Baseline noise refers to small, irregular fluctuations in the detector signal that are not caused by a useful sample part.
Noise can come from:
- Electronic detector noise
- Temperature fluctuations
- Mobile-phase mixing
- Air bubbles or outgassing
- Contaminated solvents
- Dirty detector cells
- Pump pulsation
- Column bleed
- Insufficient system equilibration
Therefore, baseline noise matters because peak counting software must decide whether a small signal is a real peak or meaningless fluctuation. Moreover, higher noise can make it difficult to determine where a peak begins and ends, affecting calculated peak area and the ability to detect low-level impurities.
Baseline drift
As a result, Baseline drift occurs when the baseline gradually rises or falls during the run. Drift is especially common in gradient methods because the mobile-phase makeup changes over time, potentially changing detector signal.
By contrast, some drift may be expected and manageable. In addition, severe drift can conceal small peaks or cause improper peak counting.
The solvent front
However, Shortly after injection, a large disturbance may appear near the beginning of the chromatogram. This is often called the solvent front, injection front, or void-volume disturbance.
Therefore, it may be caused by:
- The sample solvent
- Unretained compounds
- Salts and buffer parts
- Moreover, differences between the injection solvent and flowing solvent
- Pressure or refractive-index disturbances
As a result, a solvent-front region is often excluded from purity peak counting because it may not represent useful retained analytes. However, the exclusion window should be scientifically justified and clearly reported.
Not every early signal is an impurity—but not every early signal should be ignored
By contrast, an excluded early region may contain only an expected injection disturbance. In addition, it could also conceal unretained sample parts. However, the chromatogram, blank injection, method, and peak counting report should be reviewed together.
Why Excluded Peaks Matter
For example, hPLC purity the software calculates only from the peaks included in the peak counting and purity calculation.
Therefore, a chromatogram can contain visible signals that are:
- Not counted
- Moreover, counted but excluded from the total
- Classified as solvent-related
- As a result, ignored because they fall below a reporting cutoff
- Removed through blank subtraction
- Likewise, excluded because they occur outside a selected time window
By contrast, these decisions can be scientifically suitable. In addition, they can also greatly change the reported purity percentage.
Example: how exclusions change the result
All relevant peaks included
Main peak area: 990,000
Other peak area: 20,000
Reported purity: 98.02%
Half the other area excluded
Main peak area: 990,000
Included other area: 10,000
Reported purity: 99.00%
However, the main peak did not change. For example, the sample did not change. Therefore, only the denominator changed.
Moreover, this is why a purity number should not be evaluated without asking:
- Which peaks were included?
- Which peaks were excluded?
- As a result, what was the peak counting start time?
- Likewise, what was the peak counting stop time?
- By contrast, was the solvent front excluded?
- In addition, was a blank chromatogram used?
- However, were peaks below a certain cutoff ignored?
- For example, were any peaks manually counted?
Reporting thresholds
Therefore, a proven method may define a reporting cutoff below which very small peaks are not reported as impurities. Moreover, this may be justified when the method’s noise, detection limit, measurement limit, and intended purpose support the cutoff.
As a result, the problem is not always that a cutoff exists. Likewise, the problem occurs when the cutoff, exclusion rules, or peak counting settings are hidden while the final percentage the report presents as an absolute measurement of everything in the sample.
Why HPLC Purity Is Not Assay
By contrast, this is one of the most important distinctions in lab testing.
HPLC area purity
In addition, estimates how much of the included HPLC response belongs to the main peak compared with the total included response.
Assay or content
However, measures how much of the target substance is actually present, usually by comparing the sample response with a calibrated test standard.
A sample can be highly pure but underfilled
For example, suppose a vial is expected to contain 10 milligrams of a peptide but actually contains only 6 milligrams.
Therefore, if nearly all UV-detectable peptide-related material in the sample is the intended peptide, the chromatogram could still report 99% area purity. Moreover, the purity test describes the relative makeup of the detected material—not whether the vial contains the stated quantity.
A sample can be highly pure but diluted with invisible material
Imagine a powder containing:
- As a result, 5 milligrams of highly purified peptide
- Likewise, 45 milligrams of water, buffer salts, or another material that does not produce a useful peak under the selected HPLC conditions
By contrast, the peptide-related chromatogram might still show one dominant peak and report very high area purity. In addition, that does not mean 99% of the total powder weight is peptide.
Assay requires calibration
However, a measured assay generally requires:
- An suitable test standard
- A known standard concentration
- Accurate sample preparation
- A proven calibration model
- Defined calculations
- For example, demonstrated straight-line response, accuracy, and repeatability
- Therefore, correction for standard potency or water content when applicable
Moreover, the sample’s response the analyst compares with the test standard’s response to calculate the amount or concentration of target analyte.
As a result, Purity asks: “How much of the included HPLC signal belongs to the main peak?”
Likewise, Assay asks: “How much target compound is actually present?”
By contrast, regulatory lab guidance treats assay and impurity testing as related but distinct lab purposes, each requiring an suitable proven approach.
How Chromatogram editing Can Mislead the Reader
In addition, chromatograms require data handling. However, software must determine where peaks begin, where they end, and which signals should be counted. For example, peak counting is not automatically dishonest; it is a necessary part of HPLC testing.
Therefore, the concern is that data handling choices can be altered in ways that improve the apparent result without improving the sample.
1. Changing the peak counting cutoff
Moreover, peak counting software uses thresholds to distinguish peaks from baseline noise. As a result, raising the cutoff can cause smaller impurity peaks to be ignored.
Likewise, when fewer impurity peaks are counted, the main peak’s area percentage increases.
2. Moving the peak counting start time
By contrast, starting the calculation after an early group of peaks can remove those peaks from the total. In addition, this may be suitable for a verified solvent front, but it can be misleading when the excluded region also contains sample-related compounds.
3. Ending the run too early
However, late-eluting impurities may not appear if the HPLC run ends before they leave the column. For example, a short run can create a cleaner-looking chromatogram while leaving strongly retained compounds unreported.
4. Cropping the chromatogram
Therefore, a COA may show only a selected portion of the full run. Moreover, signals before or after the displayed window may be hidden from the reader.
5. Compressing the vertical scale
As a result, changing the y-axis scale can make small impurity peaks appear nearly invisible. Likewise, the underlying peak areas may remain unchanged, but the visual impression becomes much cleaner.
6. Expanding the main peak
By contrast, enlarging or zooming into the main peak can make it dominate the page while surrounding impurities receive little visual attention.
Display and Reporting Choices
7. Manual baseline placement
In addition, software calculates peak area by drawing a baseline beneath the peak. However, moving this baseline changes the area assigned to the peak.
For example, manual peak counting may be necessary when automatic peak counting fails, but repeated or unexplained manual baseline changes can alter reported purity.
8. Combining partially separated peaks
Therefore, a shoulder or neighboring impurity may be counted as part of the main peak instead of as a separate part. Moreover, this increases the main peak’s reported area.
9. Splitting a peak selectively
As a result, the reverse can also happen. Likewise, an analyst may split one broad signal into multiple peaks or classify certain portions differently depending on the desired calculation.
10. Removing peaks as “unknown” or “system-related”
By contrast, labeling a peak as unknown does not automatically justify excluding it. In addition, an unknown sample-related peak may still represent an impurity.
11. Using blank subtraction without showing the blank
However, blank subtraction can remove legitimate background signals from solvents, containers, or the HPLC testing system. However, inappropriate subtraction may also remove real sample peaks.
12. Selecting an advantageous wavelength
Therefore, uV detectors measure absorbance at selected wavelengths. Moreover, a wavelength may strongly detect the intended compound while responding weakly to certain impurities—or the reverse.
As a result, selecting an unsuitable wavelength can make some compounds effectively less visible.
13. Reporting only the best injection
Likewise, multiple injections may produce slightly different results. By contrast, showing only the cleanest chromatogram without reporting repeat performance can conceal variation, leftover sample, poor repeatability, or sample-preparation problems.
14. Reusing a chromatogram
In addition, a chromatogram can look legitimate while being unrelated to the product or batch listed on the COA. However, readers should look for matching sample identifiers, batch numbers, file names, injection dates, laboratory information, and traceable report metadata.
peak counting settings can change the answer
For example, hPLC testing data systems use settings such as peak width, detection thresholds, baseline rules, shoulder detection, timed peak counting events, and manual peak counting. Therefore, these settings directly affect which peaks are recognized and how their areas the software calculates.
What a Strong HPLC Report Should Include
Moreover, a credible report should provide enough information for a qualified reviewer to understand what was tested and how the result was produced.
| Report element | Why it matters |
|---|---|
| As a result, sample name and batch number | Likewise, connects the lab result to a specific submitted sample. |
| Test date | By contrast, shows when the sample was analyzed. |
| Method identity checking | In addition, explains which lab procedure was used. |
| Column information | However, helps define the separation conditions. |
| Mobile phases | For example, shows which solvents and additives carried the sample. |
| Gradient or isocratic program | Therefore, explains how solvent makeup changed during the run. |
| Flow rate and temperature | Moreover, these settings affect retention and separation. |
| Detection wavelength | As a result, shows what type of UV response was measured. |
| Injection volume | Likewise, provides context for signal strength and peak shape. |
| Full chromatogram | By contrast, allows review of the complete run rather than a cropped image. |
| Peak table | In addition, lists retention times, areas, heights, and area percentages. |
| peak counting range | However, shows which portion of the chromatogram was included. |
| Excluded peaks | For example, explains what was removed from the purity calculation. |
| Reference-standard information | Therefore, supports identity or measured assay calculations. |
| System-suitability results | Moreover, shows whether the system performed acceptably during analysis. |
| Analyst and laboratory approval | As a result, provides accountability and source record. |
How to Evaluate an HPLC COA Without Being Misled
Match the batch
Likewise, confirm that the batch or lot number on the COA matches the batch identifier on the product.
Look beyond the summary
By contrast, do not rely only on a line that says “Purity: 99.7%.” Review the chromatogram and peak table.
Check the main-peak assignment
In addition, determine how the laboratory concluded that the main peak represented the claimed compound.
Review the full time range
However, look for cropping, unusually short run times, or missing early and late portions of the chromatogram.
Inspect every visible peak
For example, compare the chromatogram with the peak table. Therefore, visible peaks should not disappear from the calculation without explanation.
Ask what was excluded
Moreover, check whether solvent fronts, blank peaks, peaks below a cutoff, or unidentified signals were excluded.
Separate purity from quantity
As a result, look for a separate assay, content, or mass test if the stated amount per vial is important.
Check identity testing
Likewise, look for mass spectrometry or another complementary identity method rather than relying solely on retention time.
Look for method details
By contrast, a percentage without useful method information is difficult to evaluate independently.
Verify the laboratory
In addition, confirm that the laboratory exists and that the report contains traceable identifiers, dates, and approval.
HPLC Cannot Answer Every Quality Question
However, hPLC is valuable, but it is only one part of a broader lab picture.
| Quality question | Is an ordinary HPLC purity test enough? | Potential additional testing |
|---|---|---|
| For example, is the main compound chemically pure? | Useful evidence, with method limits | Moreover, second-method HPLC method, LC-MS, peak-purity analysis |
| As a result, is it the claimed compound? | Not by retention time alone | By contrast, mass spectrometry, reference-standard comparison, NMR |
| In addition, how much compound is in the vial? | A separate assay is needed | However, measured assay, amino-acid analysis, calibrated HPLC |
| Is the sample sterile? | Sterility needs its own test | Sterility testing |
| For example, does it contain bacterial endotoxin? | Endotoxin needs its own test | Bacterial endotoxin testing |
| Does it contain water? | Ordinary area purity is not enough | Karl Fischer water analysis |
| Moreover, does it contain residual solvents? | A separate solvent test is needed | Gas HPLC testing |
| As a result, does it contain metal impurities? | A separate metal test is needed | Likewise, iCP-MS or another metal-analysis method |
| By contrast, is the powder visually identifiable? | Visual appearance cannot identify it | proven chemical identity testing |
Frequently Asked Questions About HPLC Purity
Peak Size, Purity, and Vial Weight
In addition, does one large peak mean the sample is pure?
However, not always. For example, the method may not detect every part, multiple compounds may co-elute, and some signals may have been excluded from peak counting. Therefore, one large peak is useful evidence, but it must be interpreted in context.
Moreover, does a 99% HPLC result mean the vial is 99% peptide by weight?
As a result, no. Likewise, it usually means about 99% of the included HPLC detector area was assigned to the main peak. By contrast, water, salts, counterions, buffers, and other weakly detected or undetected materials may not be represented by the area percentage.
In addition, can a 99% pure vial still be underfilled?
However, yes. For example, purity and quantity are different measurements. Therefore, a vial may contain less material than claimed while the material that is present produces a high-purity chromatogram.
Retention Time and Excluded Peaks
Moreover, is retention time enough to confirm identity?
As a result, no. Likewise, matching retention time can support identity when compared under controlled conditions, but unrelated compounds can have similar retention pattern. By contrast, complementary testing such as mass spectrometry provides stronger evidence.
In addition, why are some peaks excluded?
However, peaks may be excluded because they come from the solvent, blank, injection disturbance, system contamination, or signals below an established reporting cutoff. For example, every exclusion should have a documented scientific reason.
Therefore, can peak counting settings change the purity result?
Moreover, yes. As a result, peak-detection thresholds, peak counting windows, baseline placement, shoulder detection, and manual peak counting decisions can change which peaks are counted and how their areas the software calculates.
Sterility, LC-MS, and Method Limits
Likewise, can HPLC determine whether a sample is sterile?
By contrast, no. In addition, sterility and bacterial endotoxin require separate microbe or biological testing steps.
However, what is the difference between HPLC and LC-MS?
For example, hPLC separates compounds and records detector responses. Therefore, lC-MS combines liquid HPLC testing with mass spectrometry, allowing separated parts to be evaluated according to their mass-to-charge characteristics. Moreover, lC-MS can provide stronger identity information, although it also has limitations and requires suitable interpretation.
HPLC Purity Is Only as Reliable as the Method Behind It
As a result, hPLC is one of the most useful tools available for examining the chemical makeup of a sample. Likewise, a properly designed method can separate a target compound from related impurities and provide useful evidence about relative HPLC purity.
By contrast, but the number printed at the top of a COA is not the entire result.
In addition, to understand what “99% pure” actually means, the reader must consider:
- What the detector measured
- However, how the main peak was identified
- Which peaks were counted
- Which peaks were excluded
- For example, whether compounds may have overlapped
- Therefore, whether the full chromatogram was shown
- Moreover, whether the method was suitable and proven
- As a result, whether a separate measured assay was performed
Likewise, a chromatogram can provide valuable evidence. By contrast, it should not be treated as a complete guarantee of identity, quantity, sterility, safety, or overall product quality.